The only AI SRE that gets smarter with every incident
Robusta learns your environment, groups duplicates, filters the noise, and hands you only what's new.
Driving agentic flows in production at


%20--%3e%3csvg%20version='1.1'%20id='Layer_1'%20xmlns='http://www.w3.org/2000/svg'%20xmlns:xlink='http://www.w3.org/1999/xlink'%20wide='200px'%20height='200px'%20viewBox='0%200%20200%20200'%20style='enable-background:new%200%200%20200%20200;'%20xml:space='preserve'%3e%3cstyle%20type='text/css'%3e%20.st0{fill:%23A90C2B;}%20%3c/style%3e%3cg%3e%3cg%3e%3cpath%20class='st0'%20d='M190.65,57.72C174.72,23.63,140.12,0,100,0S25.28,23.63,9.35,57.72l11.33,5.28%20C34.62,33.17,64.9,12.5,100,12.5s65.38,20.67,79.32,50.5L190.65,57.72z%20M17.76,70.06L6.01,65.78C2.12,76.46,0,87.98,0,100%20c0,12.02,2.12,23.54,6.01,34.22l11.75-4.28c-3.4-9.34-5.26-19.43-5.26-29.94C12.5,89.48,14.36,79.4,17.76,70.06%20M9.35,142.28%20C25.28,176.38,59.88,200,100,200s74.72-23.62,90.65-57.72L179.32,137c-13.94,29.83-44.22,50.5-79.32,50.5S34.62,166.83,20.68,137%20L9.35,142.28z%20M182.24,70.06c3.4,9.34,5.26,19.43,5.26,29.95c0,10.52-1.86,20.6-5.26,29.94l11.75,4.28%20c3.89-10.68,6.01-22.2,6.01-34.22c0-12.02-2.12-23.55-6.01-34.22L182.24,70.06z'/%3e%3cpath%20class='st0'%20d='M82.48,80.02c-2.48,0-5.15,0.44-7.47,0.94V60.07L64.61,61.2v56.08c4.3,1.36,9.88,2.65,15.39,2.65%20c12.52,0,19.91-4.23,19.91-19.95C99.91,84.25,92.51,80.02,82.48,80.02%20M80.82,111.01c-1.89,0-3.55-0.23-5.81-0.76V89.71%20c1.87-0.43,3.73-0.77,5.81-0.77c5.66,0,8.37,2.57,8.37,11.03C89.2,108.44,86.48,111.01,80.82,111.01'/%3e%3cpath%20class='st0'%20d='M122.94,95.4c-4.45-0.08-7.24-0.15-7.24-2.57c0-3.17,1.89-3.85,7.62-3.85c3.47,0,8.37,0.68,11.46,1.43%20l-0.83-8.6c-3.99-1.21-8.44-1.74-11.38-1.74c-12.52,0-17.34,4.53-17.34,13.06c0,8.23,5.05,10.34,13.57,10.49%20c5.5,0.07,8.37-0.08,8.37,3.55c0,3.17-2.49,3.85-7.84,3.85c-5.96,0-10.18-0.91-13.27-1.89l0.83,8.6c4,1.43,7.77,2.19,13.27,2.19%20c13.35,0,17.49-4.53,17.49-12.68C137.64,96.98,130.93,95.55,122.94,95.4'/%3e%3cpath%20class='st0'%20d='M40.48,80.07c-3.32,0-7.77,0.53-11.76,1.74l-0.83,8.6c3.32-0.75,8.22-1.43,11.46-1.43%20c5.43,0,7.61,0.45,7.61,4.83v1.21l-7.24,0.38c-7.99,0.45-14.7,1.81-14.7,11.85c0,8.15,4.15,12.68,16.66,12.68%20c5.81,0,11.38-1.28,15.68-2.64V93.13C57.36,84.61,52.62,80.07,40.48,80.07%20M46.96,110.72c-1.36,0.23-3.17,0.53-5.05,0.53%20c-4.52,0-6.41-1.44-6.41-4.53c0-3.24,1.81-3.77,5.58-4l5.88-0.38V110.72z'/%3e%3cpath%20class='st0'%20d='M158.09,80.07c-3.32,0-7.77,0.53-11.76,1.74l-0.83,8.6c3.32-0.75,8.22-1.43,11.46-1.43%20c5.43,0,7.61,0.45,7.61,4.83v1.21l-7.24,0.38c-7.99,0.45-14.7,1.59-14.7,11.85c0,8.15,4.15,12.68,16.66,12.68%20c5.81,0,11.38-1.28,15.68-2.64V93.13C174.98,84.61,170.23,80.07,158.09,80.07%20M164.57,110.72c-1.36,0.23-3.17,0.53-5.05,0.53%20c-4.52,0-6.41-1.44-6.41-4.53c0-3.24,1.81-3.77,5.58-4l5.88-0.38V110.72z'/%3e%3c/g%3e%3c/g%3e%3c/svg%3e)

%20--%3e%3cdefs%3e%3cstyle%3e%20.st0%20{%20fill:%20%23dc2638;%20}%20%3c/style%3e%3c/defs%3e%3cpath%20class='st0'%20d='M0,2.3h19.4v88.6h53.5v17.1H0V2.3Z'/%3e%3cpath%20class='st0'%20d='M97.5,2.3h19.4v105.7h-19.4V2.3Z'/%3e%3cpath%20class='st0'%20d='M147.4,2.3h18.2l57.2,75.3V2.3h19.4v105.7h-18.2l-57.2-75.3v75.3h-19.4V2.3Z'/%3e%3cpath%20class='st0'%20d='M272.7,2.3h35.9c28.6,0,53.5,19.6,53.5,52.9s-24.9,52.9-53.5,52.9h-35.9V2.3ZM308.5,91.3c19.1,0,33.7-14.1,33.7-36.1s-14.6-36.1-33.7-36.1h-16.3v72.1h16.3Z'/%3e%3cpath%20class='st0'%20d='M380.2,79.8c0-13.1,9.3-21.9,19.1-25.7-9.3-4-17.4-13.1-17.4-24.7,0-16.8,14.3-29.4,36.2-29.4s22.1,3,29.5,10l-4.4,17.1c-5.9-6.7-13.2-11.5-23.8-11.5s-18.2,6.2-18.2,15.5,8.4,17.4,24.7,17.4v11.2c-18,0-26.4,8.2-26.4,18.8s8.4,16.3,20.5,16.3,18.5-5.6,24.6-12.3l4.4,17.1c-8.6,8.2-19.9,10.7-31.1,10.7-23,0-37.8-13.5-37.8-30.6Z'/%3e%3cpath%20class='st0'%20d='M485.6,2.3l27.4,38.1,27.7-38.1h22.5l-37.9,51.5,39.5,54.3h-23l-28.9-40.1-29.2,40.1h-22.5l39.5-53.6L462.6,2.3h23Z'/%3e%3c/svg%3e)


Integrates with incident.io,
PagerDuty, FireHydrant, Rootly and more.
We don't replace your incident tools. We make them autonomous.
"Solved an issue with AWS in 60 seconds, that we had spent hours debugging."
Frontier models, without the frontier bill
You pay once per incident, not once per duplicate alert. Run the smartest models on everything without paying to investigate the same alert many times.
CLAUDE CODE + MCPS
The same problems investigated again and again. Nothing is remembered.
Robusta
Only unique problems are investigated, so the bill scales with the 5, not the 500.
See what grouping does to your bill
You could use DIY Claude + MCPs and it would investigate each and every alert one at a time. Robusta groups alerts first, so you pay for 5 investigations, not 5,000.
Plug in your own numbers:
Without grouping
$350,000
/ year
−99.00%
With Robusta grouping
$3,500
/ year
With grouping, your bill scales with unique incidents, not number of duplicate alerts.
60% less tokens with auto-generated skills
Auto-generates a skill for each datasource it investigates, then auto-suggests the right one on the current investigation.
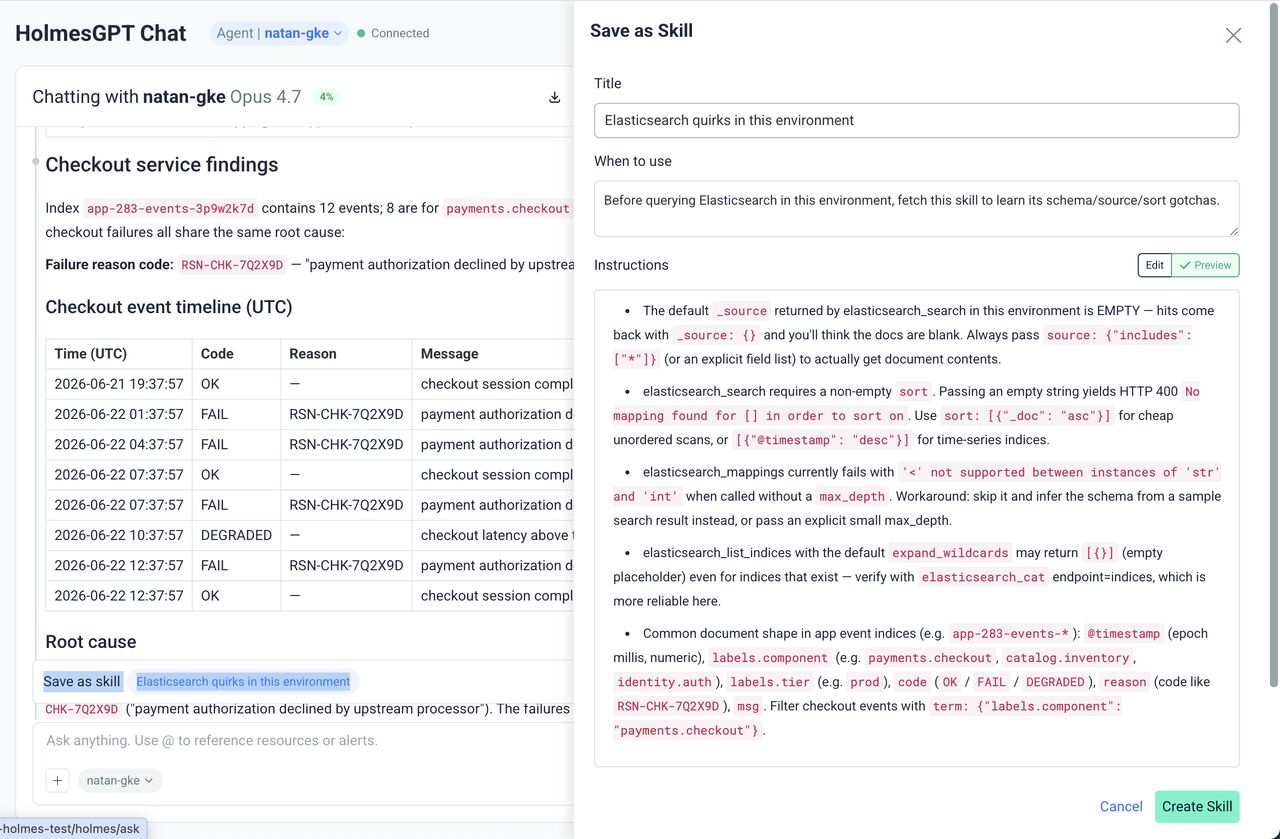
"Asked Holmes, it checked my environment, and told me to turn off a default Nginx parameter that made a huge difference. Didn't need any back and forth."
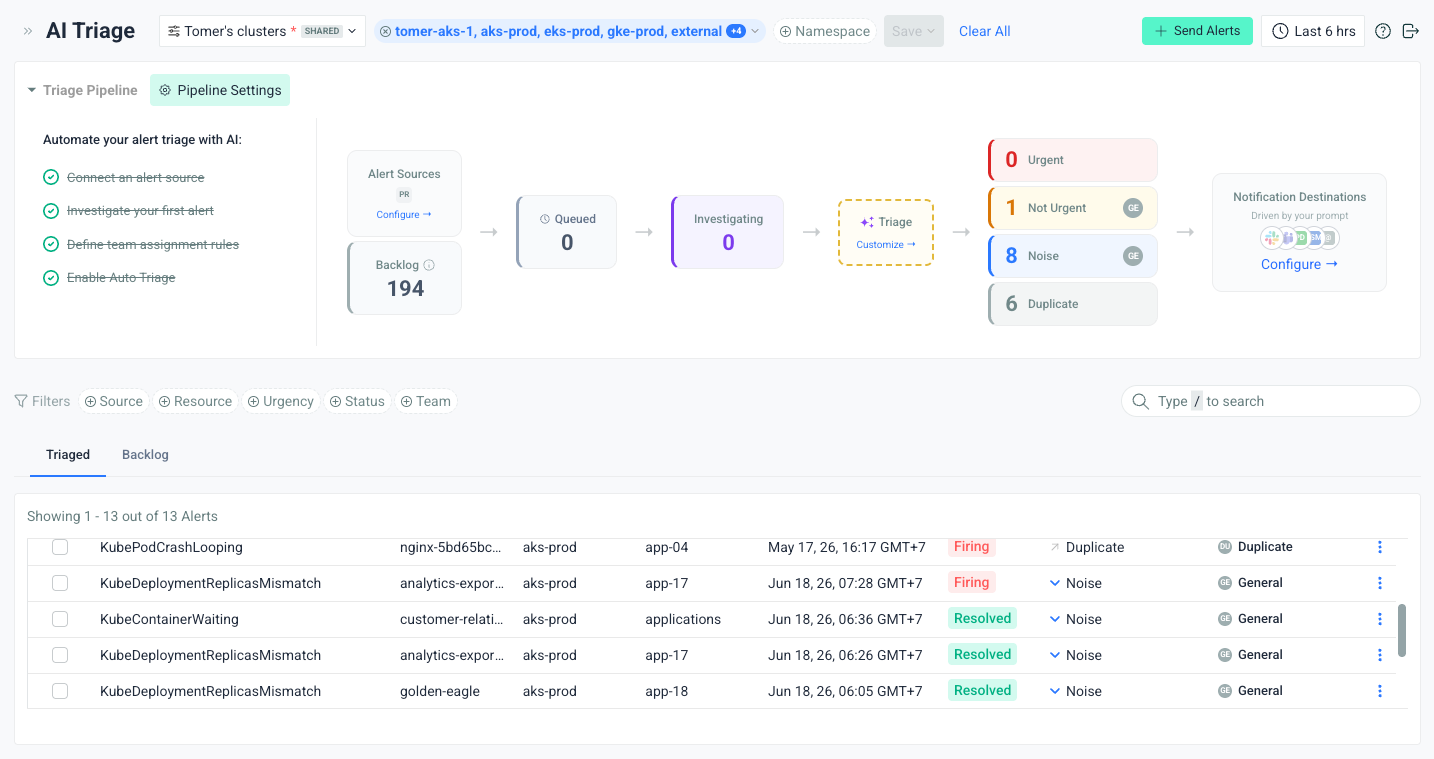
AI is the first line of response
- Investigates the moment an alert fires
- Pinpoints the root cause, blast radius, and fix
- Escalates to a human only when it has to
- On-call starts from an answer, not a raw alert
VMs, K8s, networking, and everything in between
Connect any alert source
If it can send a webhook, HTTP request, or MCP event, Robusta receives it.


'%3e%3c/path%3e%3cpath%20d='M195.422901,156.282432%20L75.2973984,156.282432%20C73.0119231,156.279908%2070.9577304,157.676287%2070.1192383,159.802395%20C69.2807461,161.928503%2069.8287946,164.351151%2071.5007459,165.909349%20L148.690618,237.955558%20C150.937998,240.051977%20153.897138,241.216897%20156.970521,241.216897%20L224.990241,241.216897%20L195.422901,156.282432%20Z'%20fill='%230078D4'%3e%3c/path%3e%3cpath%20d='M85.3432536,0.00282026831%20C80.0982223,-0.017218565%2075.4499031,3.37677358%2073.8718354,8.37881927%20L0.722997576,225.105126%20C-0.602635687,228.800183%20-0.0443562611,232.909431%202.21904685,236.116884%20C4.48244996,239.324337%208.16695154,241.227505%2012.0925898,241.216941%20L72.5684635,241.216941%20C77.154039,240.397586%2080.9441027,237.174364%2082.4892183,232.779891%20L97.0765099,189.788984%20L149.182292,238.389046%20C151.365814,240.195147%20154.104928,241.193803%20156.938519,241.216941%20L224.705129,241.216941%20L194.983595,156.282435%20L108.341367,156.3028%20L161.369401,0.00282026831%20L85.3432536,0.00282026831%20Z'%20fill='url(%23Azure-linearGradient-2)'%3e%3c/path%3e%3cpath%20d='M182.098251,8.20716985%20C180.443985,3.30365177%20175.845517,0.00290931225%20170.670472,0.00290931225%20L86.2451404,0.00290931225%20C91.4198966,0.00290931225%2096.0178956,3.30421162%2097.6729189,8.20716985%20L170.941039,225.30005%20C172.18363,228.981191%20171.576996,233.035501%20169.311351,236.191716%20C167.045705,239.34793%20163.398467,241.219806%20159.51326,241.219806%20L243.941501,241.219806%20C247.826196,241.219806%20251.472566,239.346605%20253.737531,236.190534%20C256.002496,233.034464%20256.608798,228.980705%20255.366371,225.30005%20L182.098251,8.20716985%20Z'%20fill='url(%23Azure-linearGradient-3)'%3e%3c/path%3e%3c/g%3e%3c/svg%3e)


'/%3e%3cpath%20d='M32.6625%2024.9814L25%2032.3908C26.1969%2033.5471%2027.1437%2034.9221%2027.7906%2036.4314C28.4363%2037.9373%2028.7692%2039.5586%2028.7692%2041.1971C28.7692%2042.8355%2028.4363%2044.4568%2027.7906%2045.9627C27.1437%2047.4721%2026.1969%2048.8439%2025%2050.0002L41.7656%2033.7846L32.6625%2024.9814Z'%20fill='url(%23paint1_linear_6718_2223)'/%3e%3cdefs%3e%3clinearGradient%20id='paint0_linear_6718_2223'%20x1='23.6344'%20y1='10.128'%20x2='13.3188'%20y2='20.7937'%20gradientUnits='userSpaceOnUse'%3e%3cstop%20offset='0.18'%20stop-color='%230052CC'/%3e%3cstop%20offset='1'%20stop-color='%232684FF'/%3e%3c/linearGradient%3e%3clinearGradient%20id='paint1_linear_6718_2223'%20x1='675.172'%20y1='1533.18'%20x2='1036.4'%20y2='1291.12'%20gradientUnits='userSpaceOnUse'%3e%3cstop%20offset='0.18'%20stop-color='%230052CC'/%3e%3cstop%20offset='1'%20stop-color='%232684FF'/%3e%3c/linearGradient%3e%3c/defs%3e%3c/svg%3e)


Holmes investigates your entire stack
Connect any data source via MCP server, HTTP API, or native integration. Holmes reads it all during investigation.


;}.cls-3{fill:%23f7d186;}.cls-4{clip-path:url(%23clip-path-2);}.cls-5{isolation:isolate;}.cls-6{clip-path:url(%23clip-path-3);}.cls-7{clip-path:url(%23clip-path-4);}.cls-8{clip-path:url(%23clip-path-5);}.cls-9{fill:%23ffcd3c;}.cls-10{clip-path:url(%23clip-path-7);}.cls-11{clip-path:url(%23clip-path-8);}.cls-12{fill:%23f3807b;}.cls-13{clip-path:url(%23clip-path-11);}.cls-14{clip-path:url(%23clip-path-12);}.cls-15{fill:%2335d0ba;}.cls-16{clip-path:url(%23clip-path-14);}.cls-17{fill:%23d8ae64;}%3c/style%3e%3cclipPath%20id='clip-path'%3e%3cpath%20class='cls-1'%20d='M447.73,309.78a46.75981,46.75981,0,0,0-46.76,46.76V796.58a46.76,46.76,0,0,0,93.52,0V356.55a46.75555,46.75555,0,0,0-46.76-46.77'/%3e%3c/clipPath%3e%3cclipPath%20id='clip-path-2'%3e%3cpath%20class='cls-1'%20d='M263.62,234.54q-.195,4.305-.2,8.68c0,3.19.07,6.35.24,9.5-.07,1.55-.24,3.08-.24,4.66V563.56c0,58.55,47.91,106.46,106.46,106.46H530.1c58.56,0,106.46-47.91,106.46-106.46V257.37c0-1.78-.18-3.51-.28-5.26.14-2.95.22-5.92.22-8.89,0-2.92-.07-5.8-.2-8.68C631.8,135.53,550.1,56.66,449.98,56.66,349.85,56.66,268.14,135.53,263.62,234.54Z'/%3e%3c/clipPath%3e%3cclipPath%20id='clip-path-3'%3e%3crect%20class='cls-1'%20x='142.32001'%20y='97.05'%20width='606.10999'%20height='606.10997'/%3e%3c/clipPath%3e%3cclipPath%20id='clip-path-4'%3e%3crect%20class='cls-1'%20x='121.45167'%20y='305.6912'%20width='654.37372'%20height='195.51814'%20transform='translate(-153.87924%20435.4032)%20rotate(-45)'/%3e%3c/clipPath%3e%3cclipPath%20id='clip-path-5'%3e%3crect%20class='cls-1'%20x='260.91'%20y='50.92997'%20width='382.11002'%20height='619.28997'/%3e%3c/clipPath%3e%3cclipPath%20id='clip-path-7'%3e%3crect%20class='cls-1'%20x='-22.38'%20y='-67.66'%20width='639.04998'%20height='639.05002'/%3e%3c/clipPath%3e%3cclipPath%20id='clip-path-8'%3e%3crect%20class='cls-1'%20x='-32.95044'%20y='128.3843'%20width='654.3837'%20height='241.17767'%20transform='translate(-89.86928%20280.98264)%20rotate(-45)'/%3e%3c/clipPath%3e%3cclipPath%20id='clip-path-11'%3e%3crect%20class='cls-1'%20x='280.67001'%20y='235.39999'%20width='606.11002'%20height='606.11002'/%3e%3c/clipPath%3e%3cclipPath%20id='clip-path-12'%3e%3crect%20class='cls-1'%20x='258.77901'%20y='443.79101'%20width='654.39197'%20height='193.81798'%20transform='translate(-210.70418%20572.72293)%20rotate(-45.00062)'/%3e%3c/clipPath%3e%3cclipPath%20id='clip-path-14'%3e%3cpolygon%20class='cls-1'%20points='412.96%20670.01%20494.5%20752.9%20494.5%20670.01%20412.96%20670.01'/%3e%3c/clipPath%3e%3c/defs%3e%3cg%20class='cls-2'%3e%3crect%20class='cls-3'%20x='368.03'%20y='276.84'%20width='159.41'%20height='599.44003'/%3e%3c/g%3e%3cg%20class='cls-4'%3e%3cg%20class='cls-5'%3e%3cg%20class='cls-6'%3e%3cg%20class='cls-7'%3e%3cg%20class='cls-8'%3e%3crect%20class='cls-9'%20x='115.65'%20y='70.36997'%20width='665.66'%20height='665.65997'/%3e%3c/g%3e%3c/g%3e%3c/g%3e%3c/g%3e%3c/g%3e%3cg%20class='cls-4'%3e%3cg%20class='cls-5'%3e%3cg%20class='cls-10'%3e%3cg%20class='cls-11'%3e%3cg%20class='cls-8'%3e%3crect%20class='cls-12'%20x='-55.32999'%20y='-100.60001'%20width='699.14'%20height='699.14004'/%3e%3c/g%3e%3c/g%3e%3c/g%3e%3c/g%3e%3c/g%3e%3cg%20class='cls-4'%3e%3cg%20class='cls-5'%3e%3cg%20class='cls-13'%3e%3cg%20class='cls-14'%3e%3cg%20class='cls-8'%3e%3crect%20class='cls-15'%20x='253.14'%20y='207.87'%20width='665.65999'%20height='665.65997'/%3e%3c/g%3e%3c/g%3e%3c/g%3e%3c/g%3e%3c/g%3e%3cg%20class='cls-16'%3e%3crect%20class='cls-17'%20x='380.69'%20y='636.90997'%20width='147.02997'%20height='147.66998'/%3e%3c/g%3e%3c/svg%3e)


;}%3c/style%3e%3clinearGradient%20id='linear-gradient'%20x1='168.55'%20y1='13.4'%20x2='27.2'%20y2='57'%20gradientUnits='userSpaceOnUse'%3e%3cstop%20offset='0'%20stop-color='%23fff100'/%3e%3cstop%20offset='1'%20stop-color='%23f05a28'/%3e%3c/linearGradient%3e%3c/defs%3e%3cg%20id='Layer_6'%20data-name='Layer%206'%3e%3cpath%20class='cls-1'%20d='M4.66,25H2.37a2.37,2.37,0,0,0,0,4.74H4.66a2.37,2.37,0,1,0,0-4.74ZM48.48,59.57H46.19a2.37,2.37,0,1,0,0,4.74h2.29a2.37,2.37,0,1,0,0-4.74ZM46.56,37a2.37,2.37,0,0,0-2.37-2.37H36.27a2.37,2.37,0,0,0,0,4.74h7.92A2.37,2.37,0,0,0,46.56,37ZM121.73,22.1,119.32,8.56A9.88,9.88,0,0,0,109.07,0H16.24A6.28,6.28,0,0,0,9.9,7.7l2.54,14.4a3.38,3.38,0,0,0,.08.34v0c.3,1.76-.59,2.47-1.39,2.73h0a2.37,2.37,0,0,0,.79,4.6H115.39A6.28,6.28,0,0,0,121.73,22.1ZM90.15,76.42c-1-5.25-4-7.2-7.39-7.2H58.24a2.39,2.39,0,0,0-2.37,2.4A2.37,2.37,0,0,0,58,74h0c.78.14,1.62,1.16,2.15,3.68l2.52,14a9.59,9.59,0,0,0,9.19,7.54l14.63-.07a6.28,6.28,0,0,0,6.44-7.61ZM57.73,64.48H84.34a2.27,2.27,0,0,0,.59-.09c2.46-.52,2.58-2.52,2.26-4.51L83.8,41.27c-.93-4.84-3.74-6.75-7.43-6.75H52a2.37,2.37,0,0,0-.28,4.72h0c.81.15,1.7,1.24,2.22,4l2.57,14.24v0A1.92,1.92,0,0,1,55,59.87h0a2.36,2.36,0,0,0,.79,4.59h1.9Z'/%3e%3c/g%3e%3c/svg%3e)


'%3e%3cpath%20d='M41.4395%2069.3848C28.8066%2067.8535%2019.9062%2058.7617%2019.9062%2046.9902C19.9062%2042.2051%2021.6289%2037.0371%2024.5%2033.5918C23.2559%2030.4336%2023.4473%2023.7344%2024.8828%2020.959C28.7109%2020.4805%2033.8789%2022.4902%2036.9414%2025.2656C40.5781%2024.1172%2044.4062%2023.543%2049.0957%2023.543C53.7852%2023.543%2057.6133%2024.1172%2061.0586%2025.1699C64.0254%2022.4902%2069.2891%2020.4805%2073.1172%2020.959C74.457%2023.543%2074.6484%2030.2422%2073.4043%2033.4961C76.4668%2037.1328%2078.0937%2042.0137%2078.0937%2046.9902C78.0937%2058.7617%2069.1934%2067.6621%2056.3691%2069.2891C59.623%2071.3945%2061.8242%2075.9883%2061.8242%2081.252L61.8242%2091.2051C61.8242%2094.0762%2064.2168%2095.7031%2067.0879%2094.5547C84.4102%2087.9512%2098%2070.6289%2098%2049.1914C98%2022.1074%2075.9883%206.69539e-07%2048.9043%204.309e-07C21.8203%201.92261e-07%20-1.9479e-07%2022.1074%20-4.3343e-07%2049.1914C-6.20631e-07%2070.4375%2013.4941%2088.0469%2031.6777%2094.6504C34.2617%2095.6074%2036.75%2093.8848%2036.75%2091.3008L36.75%2083.6445C35.4102%2084.2188%2033.6875%2084.6016%2032.1562%2084.6016C25.8398%2084.6016%2022.1074%2081.1563%2019.4277%2074.7441C18.375%2072.1602%2017.2266%2070.6289%2015.0254%2070.3418C13.877%2070.2461%2013.4941%2069.7676%2013.4941%2069.1934C13.4941%2068.0449%2015.4082%2067.1836%2017.3223%2067.1836C20.0977%2067.1836%2022.4902%2068.9063%2024.9785%2072.4473C26.8926%2075.2227%2028.9023%2076.4668%2031.2949%2076.4668C33.6875%2076.4668%2035.2187%2075.6055%2037.4199%2073.4043C39.0469%2071.7773%2040.291%2070.3418%2041.4395%2069.3848Z'%20fill='black'/%3e%3c/g%3e%3cdefs%3e%3cclipPath%20id='clip0_730_27126'%3e%3crect%20width='98'%20height='96'%20fill='white'/%3e%3c/clipPath%3e%3c/defs%3e%3c/svg%3e)


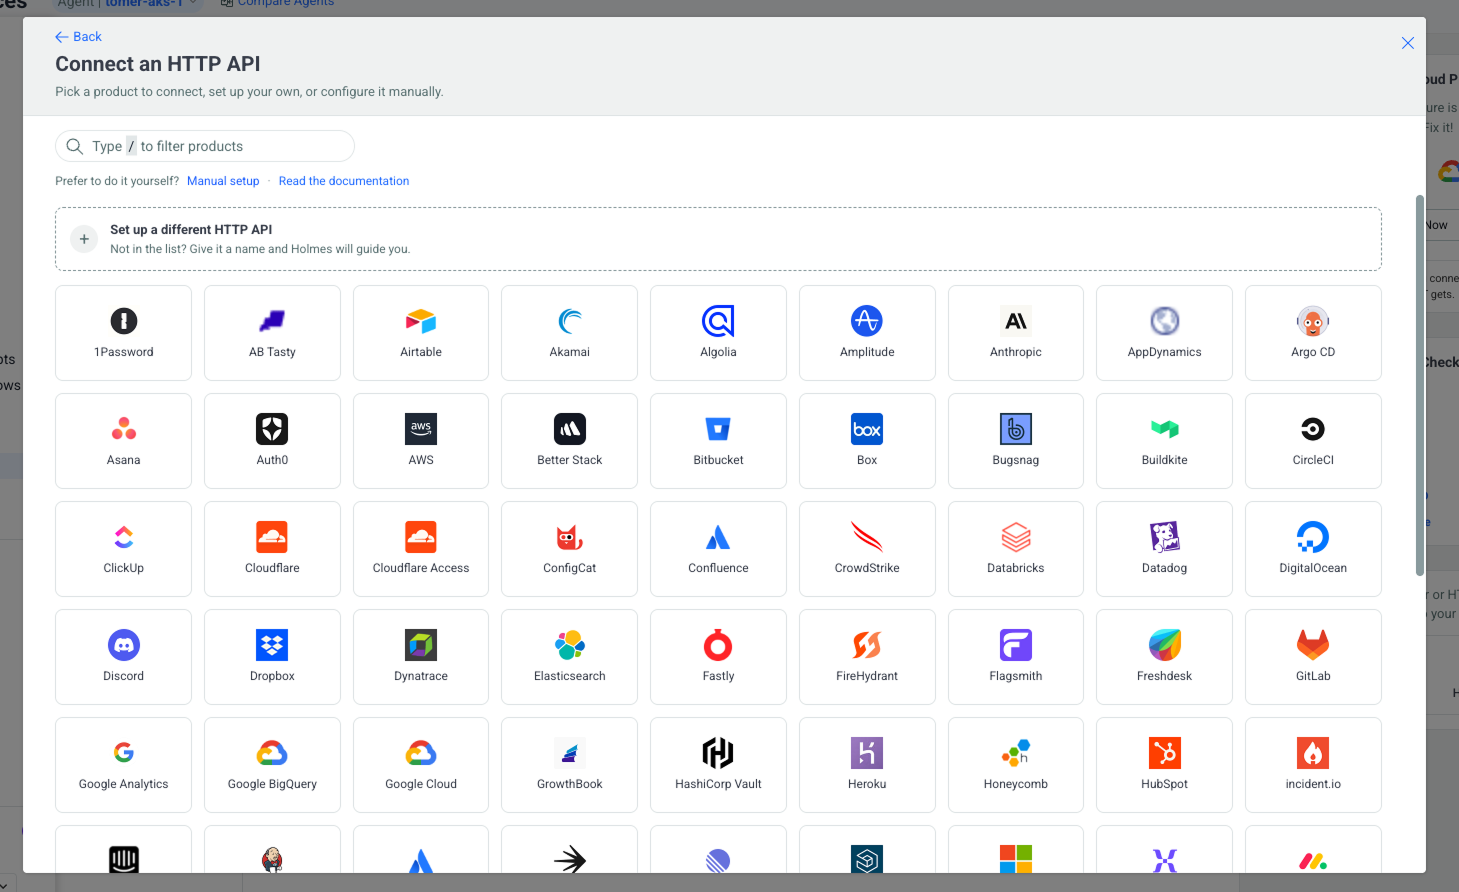
Connects to any data source
Holmes auto-generates a connector for any HTTP API — even data sources with no MCP server.
Used in heavily regulated industries
Self-hosting available — but optional
Run it as SaaS, deploy into your own VPC, or fully self-host with your own LLM key. You decide where the data lives.
We never train on your data
Your logs, traces, and incidents are used to answer your questions — never to train models, ours or anyone else's.
Read-only by default
Enforced by IAM roles and RBAC, the agent can't change your environment. Write access for auto-remediation is opt-in only.
Audit trail on every step
Every query, log line, and conclusion is logged and replayable, so audit teams see exactly what happened.
SOC 2 compliant
Independently audited controls for security, availability, and confidentiality — report available on request.
Bring your own LLM
Add your own models with your own API keys — and disable Robusta-hosted models entirely if you want. Your model, your terms.
See it running in your environment.
We'll help you get Robusta installed on your cluster and walk through a live incident.