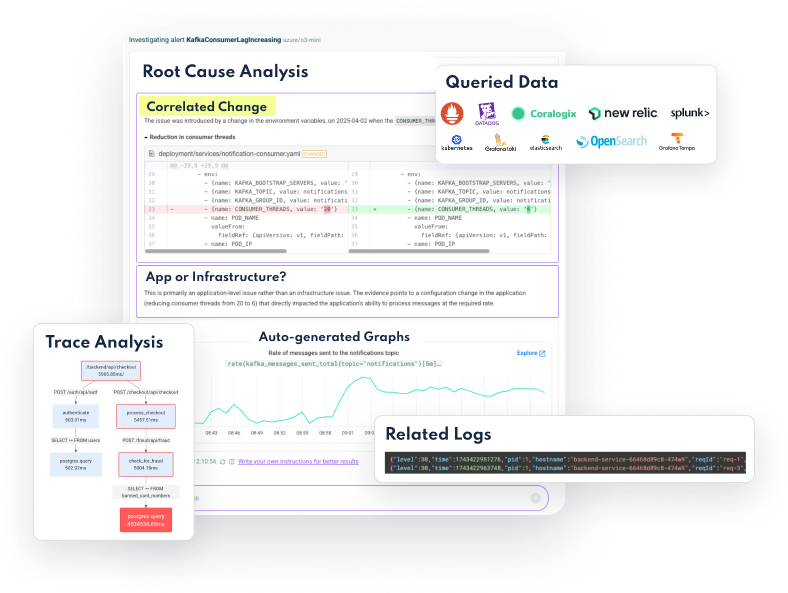
See all your clusters and alerts in a single pane of glass. Group similar issues to reduce alert fatigue. Drill down to Pod-level. See metrics, logs, and events.
Robusta alerts don’t just tell you when something is wrong. They tell you why it's wrong, so you can fix immediately.
All batteries included. Use builtin alerts to start fast. Without false positives.
But you have existing alerts? No problem. Send them to Robusta by webhook and get the best of both worlds.
Easily correlate failure with configuration change.
See change history on a chronological timeline. Even manual edits that bypassed CI/CD.
One cluster broken and another working? Run a diff and discover the reason.
Industry benchmarks show that Kubernetes apps are over-provisioned by 69% on average.
This is easily avoidable. Robusta analyzes your historical usage, gives you a recommendation, and shows you how it was calculated. Say goodbye to waste for good.
The Robusta automations engine is open source and installed on your own cloud. It can be used standalone and without any proprietary components.
The cloud platform contains everything in the open source plus the web-based observability platform. You can use it via our SaaS plans or a self-hosting plan.
Follow the installation guide in our docs to install the Robusta open source. When asked, opt-in to the Robusta UI.
Yes! You can send alerts from your existing Prometheus/AlertManager to Robusta by webhook.
Or you can install Robusta's all in one monitoring solution, based on Prometheus. Everything will be configured out of the box.
Yes. See installation instructions in the docs.
Yes. Most organizations choose the simpler cloud UI option, but it can be self-hosted as well.
For more information, see the docs.
Default alerts built for Kubernetes
Use automated runbooks to investigate alerts and automatically remediate problems
Route alerts by priority or namespace to the right channel. Supports Slack, MSTeams, and more.
Silence alerts from Slack or MS Teams with the click of a button.